Data Sets
We are excited to share that we have secured a unique data set. Data for this challenge comes from multiple traffic cameras from a city in the United States as well as from state highways in Iowa. Specifically, we have time-synchronized video feeds from several traffic cameras spanning major travel arteries of the city. Most of these feeds are high resolution 1080p feeds at 10 frames per second. The vantage point of these cameras is for traffic and transportation purposes and the data will be redacted in terms of faces and license plates to address data privacy issues. The data set has been expanded to include natural language (NL) descriptions: a group of human annotators provided three NL annotations per vehicle track for use in the training, validation, and testing. Each NL annotation provides a description of the vehicle to track/retrieve, including attributes like vehicle type and color, motions like turns, and relationships to other vehicles in the scene. The NL retrieval task (in Challenge Track 5) comprises 1,500+ queries. Moreover, we have built a synthetic vehicle dataset consisting of over 1,300 distinct vehicles and over 190,000 images. These synthetic images will form an augmented training set to be used along with the real-world traffic data set for Tracks 2 and 3.
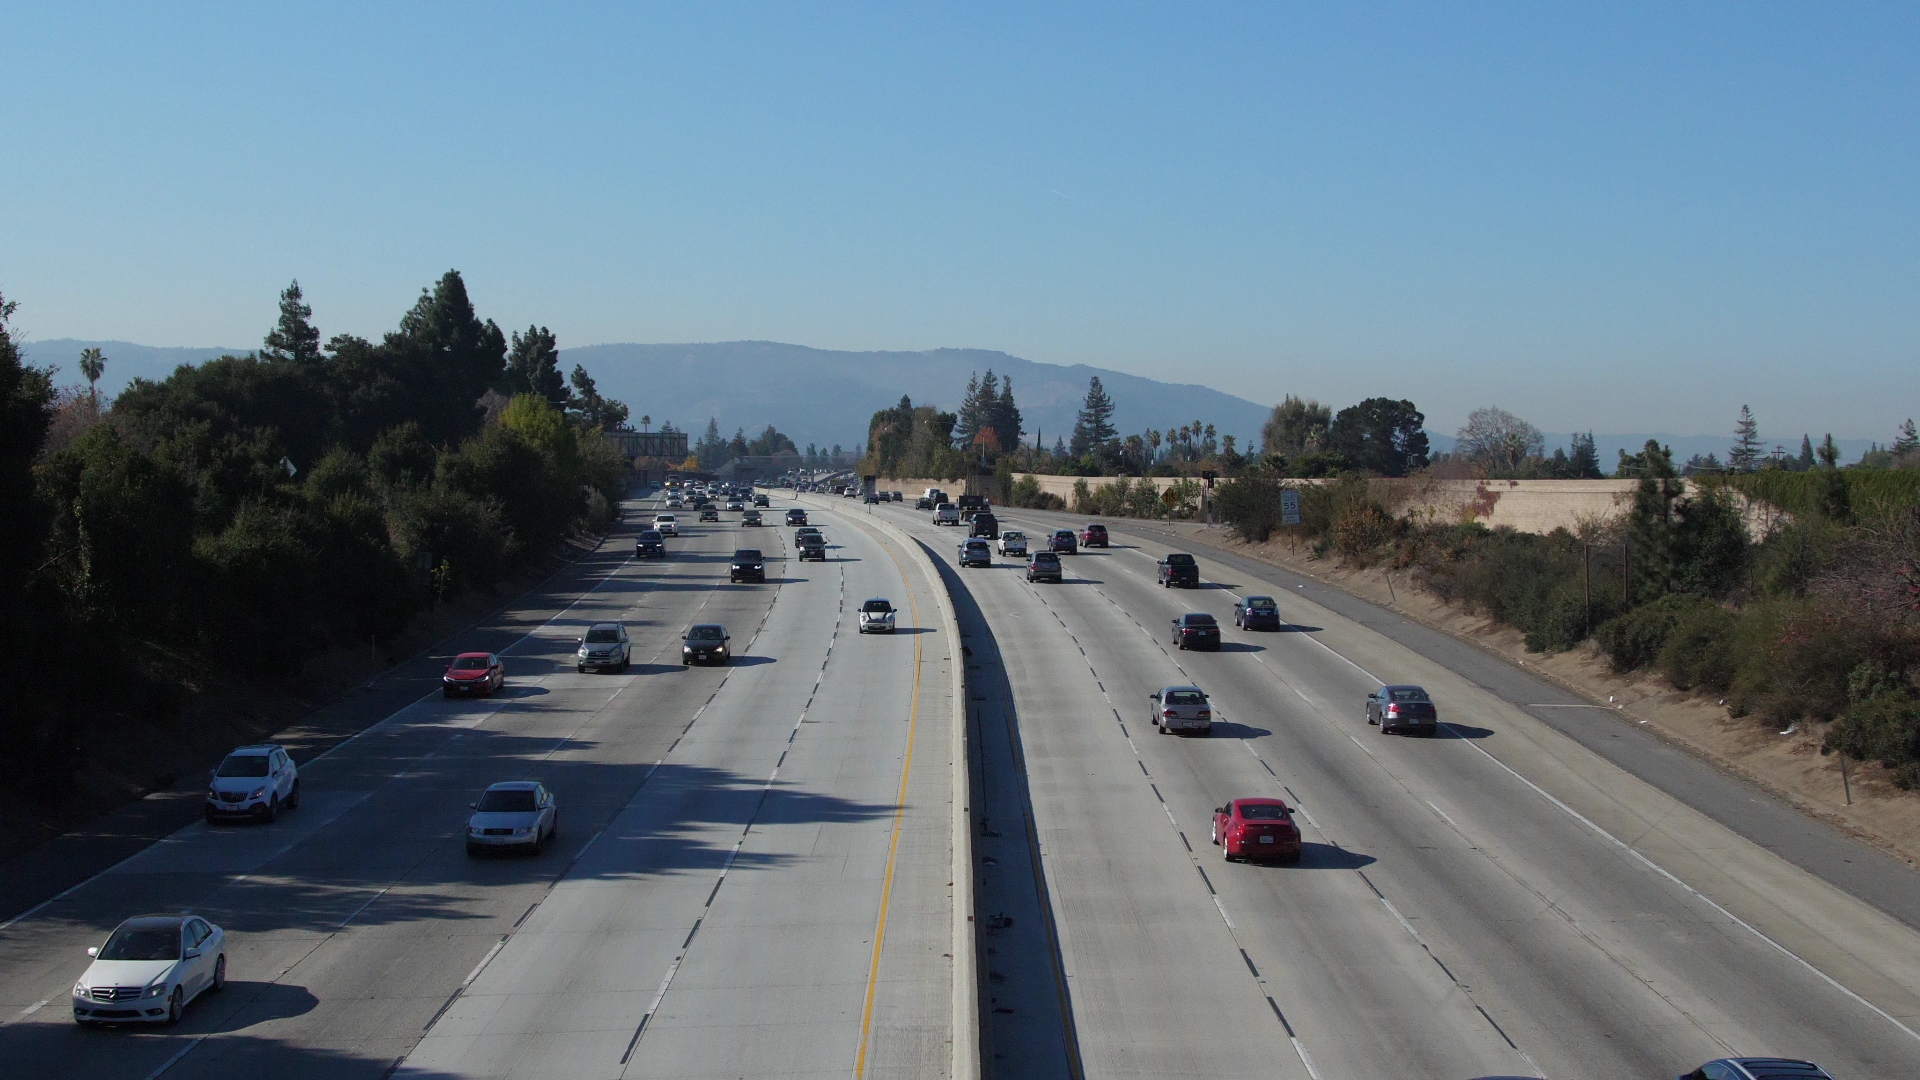
- Urban Intersection and Highway Data for Vehicle Counting – About 9 hours of videos captured from 20 different vantage points (including intersection single approaches, full intersections, highway segments and city streets) covering various lighting and weather conditions (including dawn, rain, and snow). Videos are 960p or better, and most have been captured at 10 frames per second.
- Urban Intersection and Highway Data for Multi-Camera Vehicle Tracking – Nearly 3 hours of synchronized videos synchronously captured from multiple vantage points at various urban intersections and along highways. Videos are 960p or better, and most have been captured at 10 frames per second.
- Synthetic Vehicle Data for Vehicle Re-ID – Over 190,000 images of over 1,300 distinct vehicles. These synthetic images will form an augmented training set to be used along with the real-world data for vehicle re-identification and multi-camera vehicle tracking tasks.
- Iowa State University Data – More than 62 hours of video data captured on highways in Iowa.
- Metadata about the collected videos, including GPS locations of cameras, camera calibration information and other derived data from videos.
Download Links
Track 1: Multi-Class Multi-Movement Vehicle Counting Using IoT Devices
Track 2: City-Scale Multi-Camera Vehicle Re-Identification
Track 3: City-Scale Multi-Camera Vehicle Tracking
Track 4: Traffic Anomaly Detection
Track 5: Natural Language-Based Vehicle Retrieval
Evaluation and Submission
For each of the five challenge tasks, a different data set will be provided as a set of videos or images. Associated numeric video IDs for each track are obtained by sorting track videos (or the name of the folders in which they are stored) in alphanumeric order, with numbering starting at 1. All the pixel coordinates are 0-based for all tracks.
Frame Extraction
Submissions for some tracks will require frame IDs for frames that contain information of interest. In order to ensure frame IDs are consistent across teams, we suggest that all teams use the FFmpeg library (https://www.ffmpeg.org/) to extract/count frames.
Submission Policy
Detailed submission policy will be updated soon.
Track 1: Multi-Class Multi-Movement Vehicle Counting Using IoT Devices
The data set contains 31 video clips (about 9 hours in total) captured from 20 unique camera views (some cameras provide multiple video clips to cover different lighting and weather conditions.). Each camera view comes with a detailed instruction document describing the region of interest (ROI), movements of interest (MOI) and how vehicles should be counted (please refer to the ReadMe.txt file for more details). The instruction document is meant to remove the ambiguities so that different people manually counting vehicles following instruction in the document should yield the same result. The ground truth counts for all videos are manually created and cross-validated following the provided instruction document.
- Task
A crucial tool in signal timing planning is capturing accurate movement- and class-specific vehicle counts. To be useful in online intelligent transportation systems, methods designed for this task must not only be accurate in their counting, but should also be efficient, preferably working in real-time on the edge [7]. Teams should thus design on-line real-time programs to count both cars and trucks belonging to the MOIs given a video clip. In this track, both the effectiveness of the program and its efficiency will count towards determining the winning team.
The 9 hours of video in track 1 are split into two data sets A and B. Data set A (5 hours in total) along with all the corresponding instruction documents and a small subset of ground truth labels (for demonstration purpose) are made available to participating teams. Data set B will be reserved for later testing.
Teams can design their vehicle counting programs and submit counting results of data set A to the online evaluation system to get ranked on the public leader board. The public leader board only provides a way for a team to evaluate and improve their systems and the ranking will NOT determine the winners of this track. All prize contenders have to submit functioning code to be tested on data set B. The best performer on data set B combining both the counting accuracy and the program efficiency will be declared the winner.
Each row in the submission file identifies one vehicle that exits the frame in the given movement id.
- Submission Format
To be ranked on the public leader board of data set A, one text file should be submitted to the online evaluation system containing, on each line, details of one counted vehicle, in the following format (values are space-delimited):
〈gen_time〉 〈video_id〉 〈frame_id〉 〈movement_id〉 〈vehicle_class_id〉
Where:
- 〈gen_time〉 is the generation time, i.e., the time from the start of the program execution until this frame’s output is generated, in seconds. Teams should obtain a unix timestamp at the start of the program execution and before each output to the stream and report the differences between the current unix timestamp and the program execution start unix timestamp.
- 〈video_id〉 is the video numeric identifier, starting with 1. It represents the position of the video in the list of all track videos, sorted in alphanumeric order.
- 〈frame_id〉 represents the frame count for the current frame in the current video, starting with 1.
- 〈movement_id〉 denotes the the movement numeric identifier, starting with 1. It represents the position of the movement in the list of the MOIs defined in the corresponding instruction document of that video.
- 〈vehicle_class_id〉 is the vehicle classic numeric identifier. Only two values are accepted {1, 2} where 1 stands for “car” and 2 represents “truck”.
In addition to the vehicle counts, the teams will need to report a baseline efficiency factor (Efficiency Base) and the total wall-clock execution time for the run (Execution Time), which should include the total time taken to parse the video, predict the results, and write them to the output file, including detection or tracking inference.
The text file containing all counted vehicles should be named track1.txt and can be archived using Zip (track1.zip) or tar+gz (track1.tar.gz) to reduce upload time.
The Efficiency Base factor score should be measured on the test system the experiments are executed on. If multiple systems are used for testing different runs of a team’s algorithm, a separate Efficiency Base score should be obtained for each system and the appropriate score should be provided when submitting results. The Efficiency Base factor is computed by executing the efficiency_base.py script on the system, which can be downloaded from the Track 1 download page. Note that the script will be updated for the 2021 challenge to better account for differences in GPU performance among systems.
- Online execution
The Track 1 program should be able to accept input data in a streaming fashion and provide its results also in a streaming fashion via standard output. Output data should be formatted as detailed above and any other information should be directed to standard error rather than standard output. In particular, the program should open any input video as a stream (e.g., using cv2.VideoCapture) and start producing counts output within 15 seconds from the start of its execution. At any given time t, assuming the program execution start as t_0, any output for video frames outside the range [max(t_0, t-15s), t] will be ignored in the online evaluation.
- Evaluation
The Track 1 evaluation score (S1) is a weighted combination between the Track 1 efficiency score (S1efficiency) and the Track 1 effectiveness score (S1effectiveness).
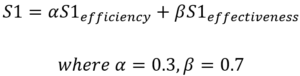
The S1efficiency score is based on the total Execution Time provided by the contestant, adjusted by the Efficiency Base factor, and normalized within the range [0, 1.1x video play-back time].
![]()
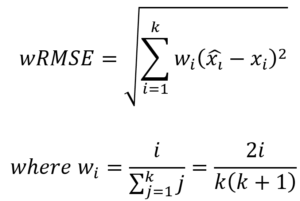
The S1effectiveness score is computed as a weighted average of normalized weighted root mean square error scores (nwRMSE) across all videos, movements, and vehicle classes in the test set, with proportional weights based on the number of vehicles of the given class in the movement. To reduce jitters due to labeling discrepancies, each video is split into k segments and we consider the cumulative vehicle counts from the start of the video to the end of each segment. The small count errors that may be seen in early buckets due to counting before or after the segment breakpoint will diminish as we approach the final segment. The nwRMSE score is the weighted RMSE (wRMSE) between the predicted and true cumulative vehicle counts, normalized by the true count of vehicles of that type in that movement. If the wRMSE score is greater than the true vehicle count, the nwRMSE score is assigned 0, else it is (1-wRMSE/vehicle count). To further reduce that impact of errors on early segments, the wRMSE score weighs each record incrementally in order to give more weight to recent records.
Note that teams self-reporting incorrect Efficiency Base factors or Execution Times will be disqualified and their submissions will be removed from the challenge. Moreover, competition prizes will only be awarded based on the scoring obtained when executing the teams’ codes on the held-out Track 1 Dataset B. To ensure comparison fairness, Dataset B experiments will be executed on the same IoT device, an NVIDIA Jetson NX development kit board.
The top 5 teams on the public leader board will be invited to submit their codes for testing on Dataset B and competing for the final prize. Teams should submit a package or a github repository containing all the source codes and detailed instructions to reproduce the experiments. All videos in the Dataset B come from the exact same 20 cameras as in the Dataset A and follow the exact same naming conventions. The submitted program should be able to load the configs for each camera (ROIs, MOIs, etc) based on the video names thus it can be directly applied on Dataset B.
Track 2: City-Scale Multi-Camera Vehicle Re-Identification
Compared with the previous edition, we have updated the entire dataset with more vehicle identities and images. The new version of the dataset can be referred to as CityFlowV2-ReID. The dataset contains 85,058 images, of which 52,717 come from 440 object identities in the training set and 31,238 from the other 440 identities in the test set. An additional 1,103 images are used as queries. Please refer to the ReadMe.txt file for more details.
- Task
Teams should find the image(s) in the test set that are from the same identity as the objects in each query image. The training set may be exploited for supervised learning.
- Submission Format
One text file should be submitted containing, on each line, a list of the top 100 matches from the test set for each query object, in ascending order of their distance to the query. The delimiter is space. Each match should be represented as the ID of the test image, which is an integer between 1 and 31,238. An example submission is given below, where IDq,k denotes the test ID for the k’th match of the q’th query.
ID1,1 ID1,2 … ID1,100
ID2,1 ID2,2 … ID2,100
…
ID1052,1 ID1052,2 … ID1052,100
The text file containing all predictions should be named track2.txt and can be archived using Zip (track2.zip) or tar+gz (track2.tar.gz) to reduce upload time.
- Evaluation
The metric used to rank the performance of each team will be the mean Average Precision (mAP) [4] of the top-K matches, which measures the mean of average precision (the area under the Precision-Recall curve) over all the queries. In our case, K=100. Our evaluation server may also provide other measures, such as the rank-1, rank-5 and rank-10 hit rates, which measure the percentage of the queries that have at least one true positive result ranked within the top 1, 5 or 10 positions, respectively.
Track 3: City-Scale Multi-Camera Vehicle Tracking
We have refined the annotations of the dataset, especially the training set, and added a new test set with 6 cameras all at different intersections of a city highway (same as the one added for the 4th edition). The new version of the dataset can be referred to as CityFlowV2. The validation set is the same as the test set of the original CityFlow dataset. The dataset contains 3.58 hours (215.03 minutes) of videos collected from 46 cameras spanning 16 intersections in a mid-sized U.S. city. The distance between the two furthest simultaneous cameras is 4 km. The dataset covers a diverse set of location types, including intersections, stretches of roadways, and highways. The dataset is divided into 6 scenarios. 3 of the scenarios are used for training, 2 are for validation, and the remaining 1 is for testing. In total, the dataset contains 313931 bounding boxes for 880 distinct annotated vehicle identities. Only vehicles passing through at least 2 cameras have been annotated. The resolution of each video is at least 960p and the majority of the videos have a frame rate of 10 FPS. Additionally, in each scenario, the offset from the start time is available for each video, which can be used for synchronization. Please refer to the ReadMe.txt file for more details.
- Task
Teams should detect and track targets across multiple cameras. Baseline detection and single-camera tracking results are provided, but teams are also allowed to use their own methods.
- Submission Format
One text file should be submitted containing, on each line, details of a detected and tracked vehicle, in the following format. Values are space-delimited.
〈camera_id〉 〈obj_id〉 〈frame_id〉 〈xmin〉 〈ymin〉 〈width〉 〈height〉 〈xworld〉 〈yworld〉
- 〈camera_id〉 is the camera numeric identifier, between 1 and 46.
- 〈obj_id〉 is a numeric identifier for each object. It should be a positive integer and consistent for each object identity across multiple cameras.
- 〈frame_id〉 represents the frame count for the current frame in the current video, starting with 1.
- The axis-aligned rectangular bounding box of the detected object is denoted by its pixel-valued coordinates within the image canvas, 〈xmin〉 〈ymin〉 〈width〉 〈height〉, computed from the top-left corner of the image. All values are integers.
- 〈xworld〉 〈yworld〉 are the GPS coordinates of the projected bottom points of each object. They are not currently used in the evaluation but may be used in the future. As such, it would be beneficial to include them if possible.
The text file containing all predictions should be named track3.txt and can be archived using Zip (track3.zip) or tar+gz (track3.tar.gz) to reduce upload time.
- Evaluation
For MTMC tracking, the IDF1 score [1] will be used to rank the performance of each team. IDF1 measures the ratio of correctly identified detections over the average number of ground-truth and computed detections. The evaluation tool provided with our dataset also computes other evaluation measures adopted by the MOTChallenge [2], [3], such as Multiple Object Tracking Accuracy (MOTA), Multiple Object Tracking Precision (MOTP), mostly tracked targets (MT), and false alarm rate (FAR). However, they will NOT be used for ranking purposes. The measures that will be displayed in the evaluation system are IDF1,IDP, IDR, Precision (detection) and Recall (detection).
Track 4: Traffic Anomaly Detection
The dataset contains 100 training and 150 test videos, each approximately 15 minutes in length, recorded at 30 fps and 410p resolution. Anomalies can be due to car crashes or stalled vehicles. Please note that regular congestion not caused by any traffic incident does not count as an anomaly. The “train-anomaly-results.txt” file in the dataset contains the anomalies in the training videos present in “train-data” folder. The schema is in the following format. Values are space-delimited, without headers.
〈video_id〉 〈start timestamp〉 〈end timestamp〉
- 〈video_id〉 is the video numeric identifier, starting with 1. It represents the position of the video in the list of all track videos, sorted in alphanumeric order.
- 〈start timestamp〉 is the anomaly start time, in seconds, from the start of the video.
- 〈end timestamp〉 is the anomaly end time, in seconds, from the start of the video.
For example, a line with “2 587 894” means that the 2.mp4 video in the “train-data” folder contains an anomaly with the start timestamp 587, referring to 587.0 seconds from the onset of the video, i.e., 9 minutes and 47 seconds into the video. Similarly, the anomaly end time is 894.0 seconds, i.e., 14 minutes and 54 seconds into the video.
- Task
Teams should identify all anomalies present in all 150 test set videos.
- Submission Format
One text file should be submitted containing, on each line, details of a detected anomaly, in the following format. Values are space-delimited.
〈video_id〉 〈timestamp〉 〈confidence〉
- 〈video_id〉 is the video numeric identifier, starting with 1. It represents the position of the video in the list of all track videos, sorted in alphanumeric order.
- 〈timestamp〉 is the relative time, in seconds, from the start of the video, denoted as a float (e.g., 12.3456).
- 〈confidence〉 denotes the confidence of the prediction.
At most 100 anomalies can be included in the submission. The text file containing all predictions should be named track4.txt and can be archived using Zip (track4.zip) or tar+gz (track4.tar.gz) to reduce upload time.
- Evaluation
Evaluation for track 4 will be based on model anomaly detection performance, measured by the F1-score, and detection time error, measured by RMSE. Specifically, the track 4 score will be computed as
![]() where F1 is the F1-score and NRMSE is the normalized root mean square error (RMSE). The S4 score ranges between 0 and 1, and higher scores are better.
where F1 is the F1-score and NRMSE is the normalized root mean square error (RMSE). The S4 score ranges between 0 and 1, and higher scores are better.
For the purpose of computing the F1-score, a true-positive (TP) detection will be considered as the predicted anomaly within 10 seconds of the true anomaly (i.e., seconds before or after) that has the highest confidence score. Each predicted anomaly will only be a TP for one true anomaly. A false-positive (FP) is a predicted anomaly that is not a TP for some anomaly. Finally, a false-negative (FN) is a true anomaly that was not predicted.
We compute the detection time error as the RMSE of the ground truth anomaly time and predicted anomaly time for all TP predictions. In order to eliminate jitter during submissions, normalization will be done using min-max normalization with a minimum value of 0 and a maximum value of 300, which represents a reasonable range of RMSE values for the task. Teams with RMSE greater than 300 will receive an NRMSE of 1, and thus an S4 score of 0.
Track 5: Natural Language-Based Vehicle Tracking
The dataset for this track is built upon the CityFlow Benchmark by annotating vehicles with natural language descriptions (need to download track3 data as well in order to work on this track). This dataset contains 2498 tracks of vehicles with three unique natural language descriptions each. 530 unique vehicle tracks together with 530 query sets each with three descriptions are curated for this challenge.
The dataset curated for this challenge track consists of three files: train-tracks.json, test-tracks.json, test-queries.json. Please refer to the README file in the data set for details.
- Task
Teams should retrieve and rank the provided vehicle tracks for each of the queries. A baseline retrieval model is provided as a demo for a start point for participating teams.
- Submission Format
One JSON file should be submitted containing a dictionary in the format of the following:
{
query-uuid-1: [track-uuid-i, …, track-uuid-j],
query-uuid-2: [track-uuid-m, …, track-uuid-n],
}
For each query, teams should submit a list of provided testing tracks ranked by the retrieval model.
- Evaluation
The Vehicle Retrieval by NL Descriptions task is evaluated using standard metrics for retrieval tasks. We use the Mean Reciprocal Rank (MRR) [9] as the main evaluation metric. Recall @ 5, Recall @ 10, and Recall @ 25 are also evaluated for all submissions.
Additional Datasets
Teams that wish to be listed in the public leader board and win the challenge awards are NOT allowed to use any external data for either training or validation. The winning teams and runners-up are required to submit their training and testing codes for verification after the challenge submission deadline in order to ensure that no external data was used for training and the tasks were performed by algorithms and not humans.
References
[1] E. Ristani, F. Solera, R. S. Zou, R. Cucchiara, and C. Tomasi. Performance measures and a data set for multi-target, multi-camera tracking. ECCVW, pages 17–35, 2016.
[2] K. Bernardin and R. Stiefelhagen. Evaluating multiple object tracking performance: The CLEAR MOT metrics. Imageand Video Processing, 2008.
[3] Y. Li, C. Huang, and R. Nevatia. Learning to associate: Hybrid boosted multi-target tracker for crowded scene. CVPR, pages 2953–2960, 2009.
[4] L. Zheng, L. Shen, L. Tian, S. Wang, J. Wang, and Q. Tian. Scalable person re-identification: A benchmark. ICCV, pages 1116–1124, 2015.
[5] Z. Tang, M. Naphade, M-Y Liu, X. Yang, S. Birchfield, S. Wang, R. Kumar, D. Anastasiu. and J.N. Hwang. Cityflow: A city-scale benchmark for multi-target multi-camera vehicle tracking and re-identification. CVPR, pages 8797-8806, 2019.
[6] Y. Yao, L. Zheng, X. Yang, M. Naphade, and T. Gedeon. Simulating Content Consistent Vehicle Datasets with Attribute Descent. ECCV, pages 775-791, 2020.
[7] D. C. Anastasiu, J. Gaul, M. Vazhaeparambil, M. Gaba and P. Sharma. Efficient City-Wide Multi-Class Multi-Movement Vehicle Counting: A Survey. J. Big Data Anal. Transp. (2020).
[8] Q. Feng, V. Ablavsky, and S. Sclaroff. CityFlow-NL: Tracking and Retrieval of Vehicles at City Scale by Natural Language Descriptions. arXiv preprint:2101.04741, 2021.
[9] Voorhees, Ellen M. “The TREC-8 question answering track report.” In Trec, vol. 99, pp. 77-82. 1999.