*Sample Evaluation Data
2018 Datasets
Several hours of videos captured at multiple intersections and along highways in Silicon Valley and in Iowa with recording from the multiple sensors capturing flow of traffic along a major arterial and multiple traffic intersections.
A fleet of controlled vehicles will be driven through these intersections that will record these vehicles. The ground truth data of fleet movement will be used for evaluation purposes and will not be shared with participants.
Download evaluation dataset for each Challenge Track.
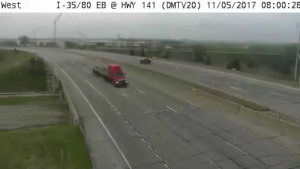
Track 2: Anomaly Detection Dataset
Track 3: Vehicle Reidentification Dataset
Evaluation
For each of the three challenge tasks, a different dataset will be provided as a set of videos. Associated numeric video IDs for each track are obtained by sorting track videos in alphanumeric order and numbering starting with 1.
Frame Extraction
Submissions for some tracks will require frame IDs for frames that contain information of interest. In order to ensure frame IDs are consistent across teams, we suggest that all teams use the FFmpeg library (https://www.ffmpeg.org/) to extract/count frames. Additionally, metadata files for each video in tracks 1 & 3 will contain the number of frames in each video, which can be used to double-check proper frame counting.
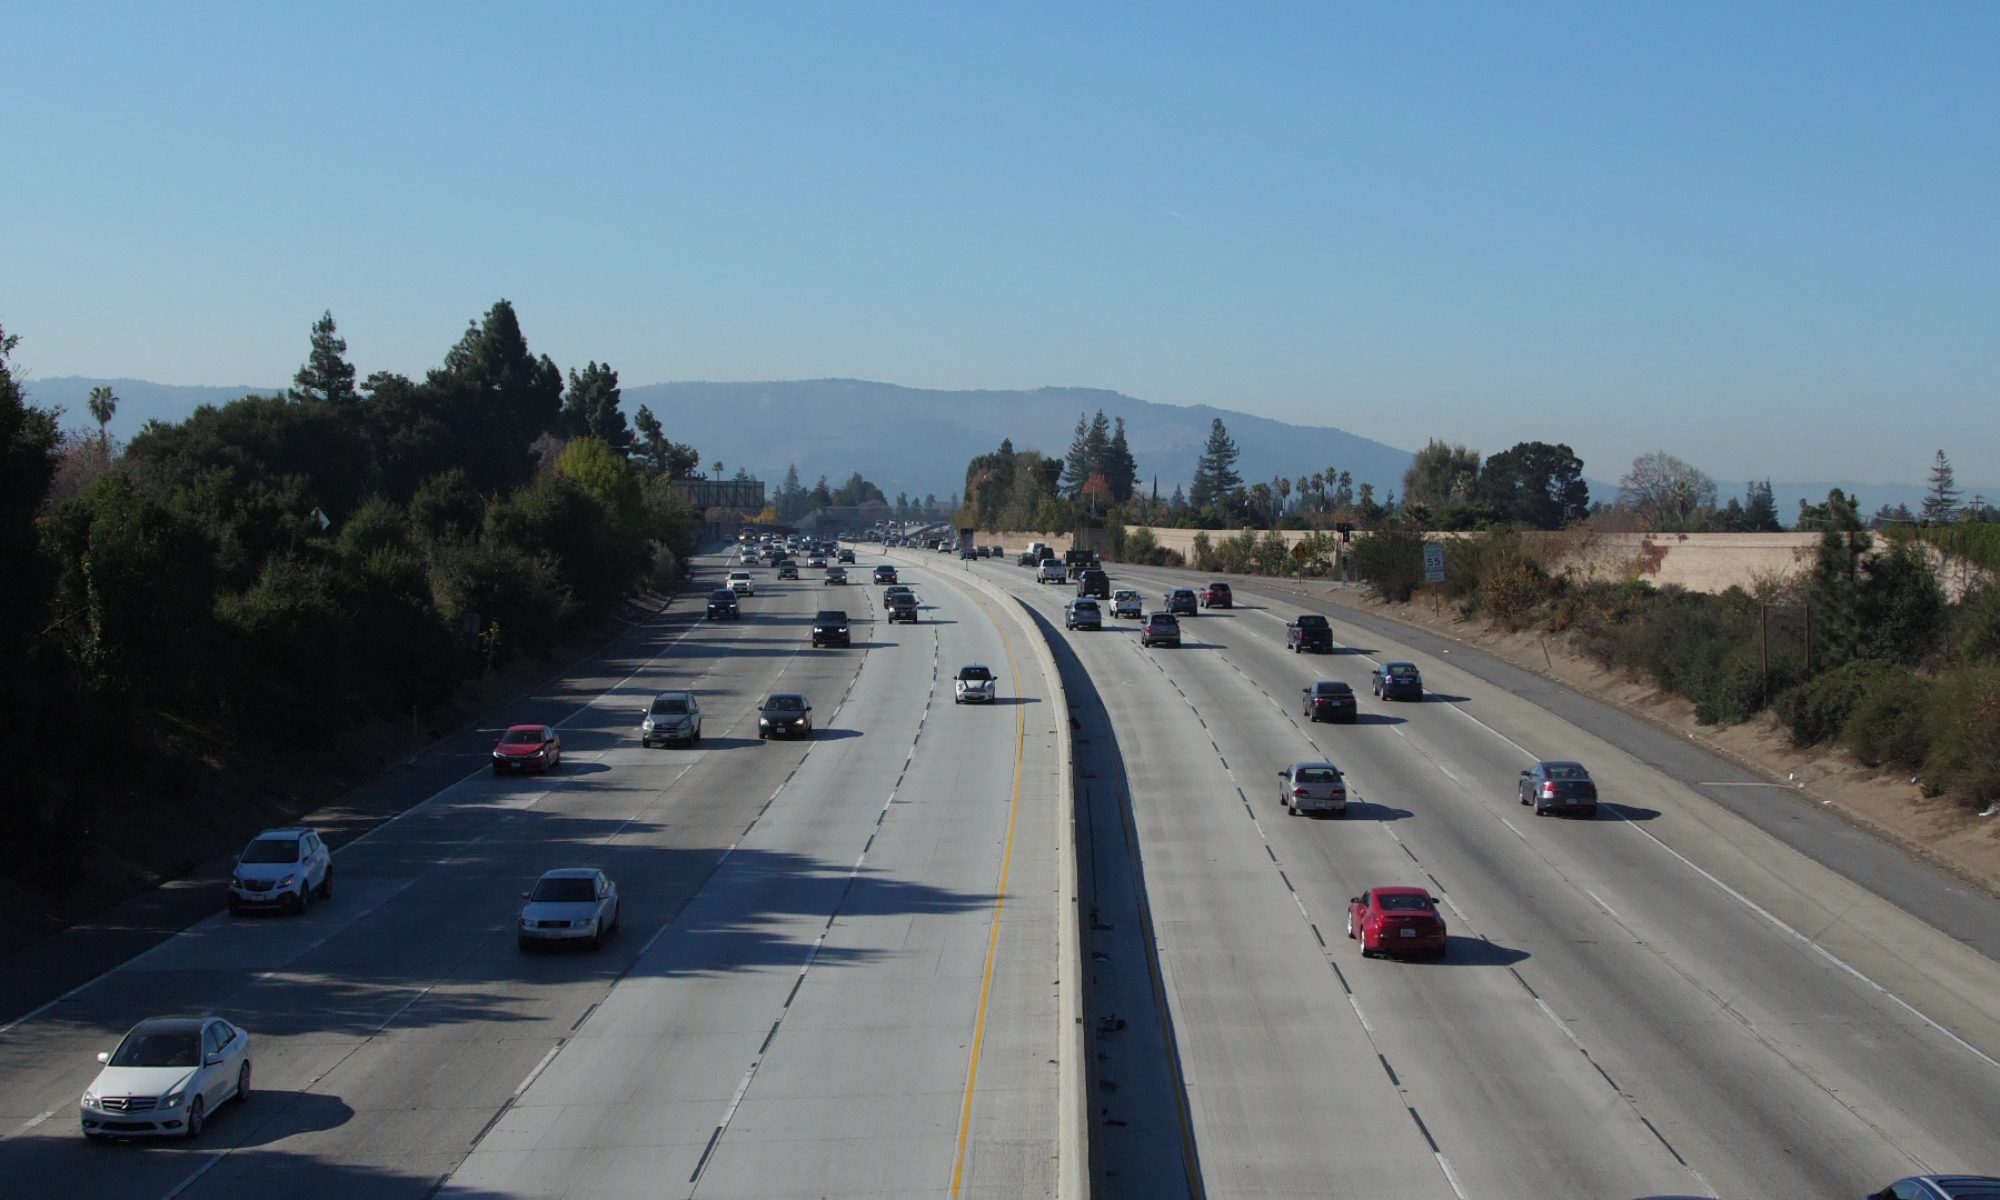
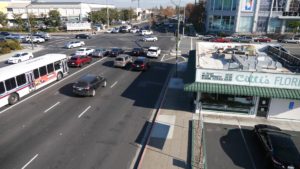
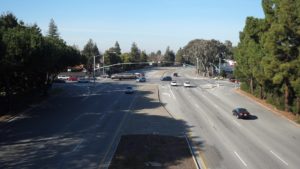
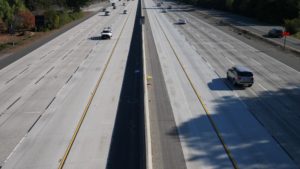
Track 1: Traffic Flow Analysis
The track 1 dataset contains 27 videos, each 1 minute in length, recorded at 30 frames per seconds (fps) and 1080p resolution (1920×1080). Videos were recorded in 4 locations and multiple videos were recorded at different times for some locations. Videos are named Loc_.mp4, where X is a location ID and Y is the video ID. An additional file associated with each video, Loc_-meta.txt, will contain metadata for the video, including location, category (highway or intersection), GPS coordinates, orientation, file size in bytes, video length, resolution, frames per second, and total number of frames.
Task
Teams should identify the speed of all vehicles on the main thruways in all frames of all given videos. Vehicles on side or background streets can be ignored.
Submission Format
One text file should be submitted containing, on each line, details of a detected vehicle, in the following format. Values are space-delimited.
- is the video numeric identifier, starting with 1. It represents the position of the video in the list of all track videos, sorted in alphanumeric order.
- represents the frame count for the current frame in the current video, starting with 1.
- is a numeric identifier. It is integer. It can be ignored for Track 1 (set to -1).
- The axis-aligned rectangular bounding box of the detected video will be denoted by its pixel-valued coordinates within the image canvas, , computed from the top-left corner of the image (similar to the VOC2012 challenge format). All coordinates are integers.
- denotes the instantaneous speed of the vehicle in the given frame, measured in miles per hour (mi/h), which is a non-negative real value.
- denotes the confidence of the prediction. Should be between 0 and 1.
The confidence score is not currently used in the evaluation but may be used in the future. As such, it would be beneficial to include confidence scores if possible.
The text file containing all predictions should be named track1.txt and can be archived using Zip (track1.zip) or tar+gz (track1.tar.gz) to reduce upload time.
Evaluation
Speed data has been collected via in-vehicle tracking for a subset of the cars in each video, which we call ground-truth vehicles. Track 1 will be evaluated based on the ability to localize these vehicles and predict their speed. For each ground-truth vehicle, an independent party has annotated the vehicle in all frames it appears in with a bounding box. An interpolation function was used to assign speed estimates in each frame based on the tracker speed data. Track 1 score will be computed as
S1 =DR*(1-NRMSE)
where DR is the detection rate and NRMSE is the normalized root mean square error (RMSE). The S1 score ranges between 0 and 1, and higher S1 scores are better.
DR is computed as the ratio of detected ground truth vehicles and the total number of ground truth vehicles. A vehicle is said to be detected if it was localized in at least 30% of frames it appeared in. A vehicle is localized if at least one predicted bounding box exists with intersection-over-union (IOU) score of 0.5 or higher relative to the annotated bounding box for the vehicle.
We compute the speed estimate error as the RMSE of the ground truth vehicle speed and predicted speed for all correctly localized ground-truth vehicles. If multiple bounding boxes with IOU >= 0.5 exist, we consider only the speed estimate from the one with the highest confidence score. NRMSE is the normalized RMSE score across all teams, obtained via min-max normalization given all team submissions. Specifically, NRMSE is computed as
[latexpage]
\[\quicklatex{size=12}
NRMSE_i = \frac{RMSE_i-RMSE_{min}}{RMSE_{max}-RMSE_{min}}
\]
where RMSEmin and RMSEmax are the minimum and maximum RMSE values among all teams, respectively.
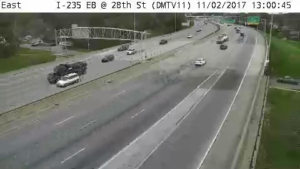
Track 2: Anomaly Detection
The track 2 dataset contains 100 videos, each approximately 15 minutes in length, recorded at 30 fps and 800×410 resolution. An additional sample set of four videos will include anomaly annotations. The anomaly can be due to car crashes or stalled vehicles. Please note that regular congestion not caused by any traffic incident does not count as an anomaly. For example, see “3.mp4” in the sample data which does not have any anomaly. Two of the sample set videos are anomaly-free.
Task
Teams should identify all anomalies present in all 100 test set videos.
Submission Format
One text file should be submitted containing, on each line, details of a detected anomaly, in the following format. Values are space-delimited, without headers.
- is the video numeric identifier, starting with 1. It represents the position of the video in the list of all track videos, sorted in alphanumeric order.
- is the relative time, in seconds, from the start of the video (e.g., 12.3456).
- denotes the confidence of the prediction. Should be between 0 and 1.
In sample videos, the timestamp 260 refers to 260.0 seconds from the onset of the video, i.e. 4 minutes and 20 seconds into the video.
The confidence score should be between 0 and 1. It is not currently used in the evaluation but may be used in the future. As such, it would be beneficial to include confidence scores if possible.
At most 100 anomalies can be included in the submission. The text file containing all predictions should be named track2.txt and can be archived using Zip (track2.zip) or tar+gz (track2.tar.gz) to reduce upload time.
Evaluation
Evaluation for track 2 will be based on model anomaly detection performance, measured by the F1-score, and detection time error, measured by RMSE. Specifically, the track 2 score will be computed as
S2=F1*(1-NRMSE)
For the purpose of computing the F1-score, a true-positive (TP) detection will be considered as the predicted anomaly within 5 minutes absolute time distance of the true anomaly that has the highest confidence score. Each predicted anomaly will only be a TP for one true anomaly. A false-positive (FP) is a predicted anomaly that is not a TP for some anomaly. Finally, a false-negative (FN) is a true anomaly that was not predicted. Note that a multi-car event (e.g., one crash followed by another crash, or a stalled car followed by someone else stopping to help) is considered a single anomaly. In particular, if a second event happens within 2 minutes of the first, it should be counted the same anomaly as the first.
We compute the detection time error as the RMSE of the ground truth anomaly time and predicted anomaly time for all TP predictions. NRMSE is the normalized RMSE score across all teams, obtained via min-max normalization given all team submissions.
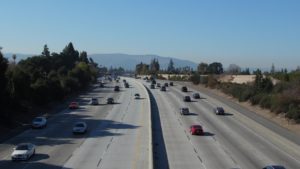
Track 3: Multi-Sensor Vehicle Detection and Reidentification
The track 3 dataset contains 15 videos, each around 0.5-1.5 hours long, recorded at 30 fps and 1080p resolution (1920×1080). Naming conventions and metadata information are the same as in track 1.
Task
Teams should identify all vehicles that pass through each recorded location at least once in the given set of videos.
Submission Format
The submission format is the same as the one for track 1, but information should be included only for vehicles identified as passing through all recorded locations. The value should be the same for a vehicle across all frames and videos the vehicle is found in. There should be at most one object ID localization record in a given frame. Moreover, at most 100 tracked vehicles can be included in a submission (i.e., 100 unique object IDs). The value can be ignored for Track 3 (set to -1). The text file containing all predictions should be named track3.txt and can be archived using Zip (track3.zip) or tar+gz (track3.tar.gz) to reduce upload time.
Evaluation
Track 3 will be evaluated based on tracking accuracy and localization sensitivity for a set of ground-truth vehicles that were driven through all sensor locations at least once. Specifically, the track 3 score will be computed as
S3= 0.5*(TDR+PR)
where TDR is the track detection rate and PR is the localization precision. The S3 score ranges between 0 and 1, and higher S3 scores are better.
The track detection rate TDR is the ratio of correctly identified ground-truth vehicle tracks and the total number of ground-truth vehicle tracks. A vehicle track is correctly identified if the vehicle has been localized (IOU >= 0.5) and associated with the same in at least 30% of the frames containing the ground-truth vehicle in a given video.
The precision PR is the ratio of correctly localized bounding boxes and the total number of predicted boxes across all videos.
Additional Datasets
Participants are free to use any other datasets and models they wish in the challenge.
Submission
Submission Policy
The submission site for the challenge and credentials will be provided to participating teams one week before the submission deadline. Each team can only submit one solution for each challenge track. Winning teams will also need to provide codes that can be used to verify the submitted results.
Submission Site
Please submit your results here.